


The Consumer Price Index for Sint Maarten has increased in the month of April 2017 by 0.5 percent compared to that of February 2017.
When comparing average consumer prices over a twelve month period (April 2016 to April 2017) an inflation rate of 1.0% is recorded.
This is evident from the data released by the Department of Statistics (STAT) today.
Price changes between April 2017 and February 2017
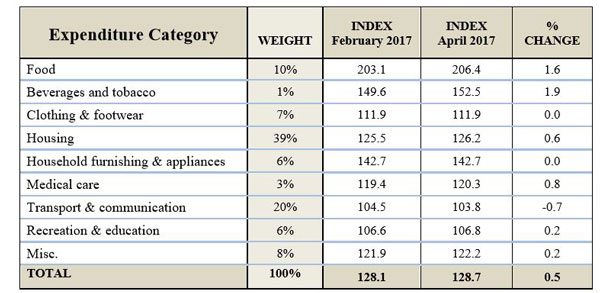
The Consumer Price Index for Sint Maarten has increased in the month of April 2017 by 0.5 percent compared to that of February 2017. The price index recorded in April 2017 is 128.7
Expenditure Categories – overall increase
In April 2017, six of the nine expenditure categories recorded positive percentage changes (prices increased), one was negative (price decreased) and two remained stable. Prices increased in: ‘Food’ (+1.6%), ‘Beverages and Tobacco’ (+1.9%), ‘Housing’ (+0.6%), ‘Medical Care’ (+0.8%), ‘Recreation & Education’ (+0.2%) and ‘Miscellaneous’ (+0.2%). Whereas, a decrease was recorded for the expenditure category ‘Transport & Communication’ (-0.7%). The expenditure categories: ‘Clothing & Footwear’ and ‘Household Furnishing & Appliances’ remained constant.
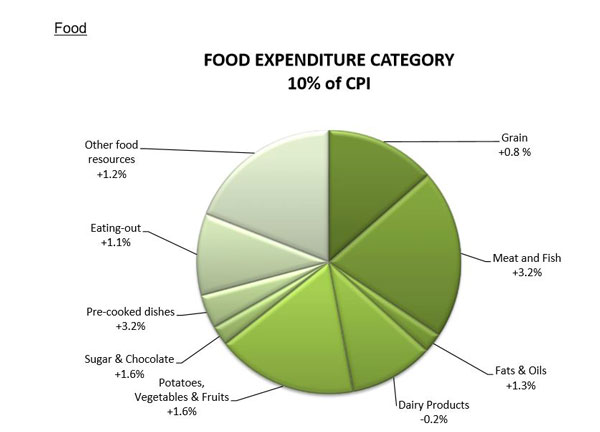
Within the Food category, eight of the nine sub groups became more expensive, while one was less expensive. The following groups recorded increases: Grain (+0.8%), Meat and Fish (+3.2%), Fats & Oils (+1.3%), Potatoes, Vegetables & Fruits (+1.6%), Sugar & Chocolate (+1.6%), Pre-cooked Dishes (+3.2%), Eating-out (+1.1%) and Other Food Resources (+1.2%), while Dairy Products (-0.2%) became cheaper.
More specifically, certain products within the Food subgroups largely influenced the total price change of the Food category. Hence, the group ‘Grain’ was influenced by grain snacks (+11.8%) and whole wheat bread & rye bread (+8%). The group ‘Meat & Fish’ was impacted most by: beef (+28.7%), other poultry (-18.6%), pork meat n.e.c2 (+7.8%), fish (+5.8%), spareribs (+4%), other fish n.e.c2 (+2.6%), chicken & chicken organs (+2.3%) and pork chops (+1.7%). The largest influence on the ‘Dairy Products’ was cheese (-1.8%).
The price change of the subgroup ‘Potatoes, Vegetables & Fruits’ was largely due to: leafy greens (+30.1%), sweet peppers (+14.7%), spices (+11.1%), fresh fruit n.e.c2 (-8.4%), grapes and prunes (+8.1%), potatoes (6.3%), apples and pears (-5.6%), tomatoes (-4.5%), raisins (-3%), other fresh vegetables (-3%), and cabbage (-2.4%).
1 Please note that the pie chart above depicts the share (weight) each food group carries toward the entire Food expenditure category, whilst the percentages indicate the price change within that food group. 2: Not elsewhere classified.
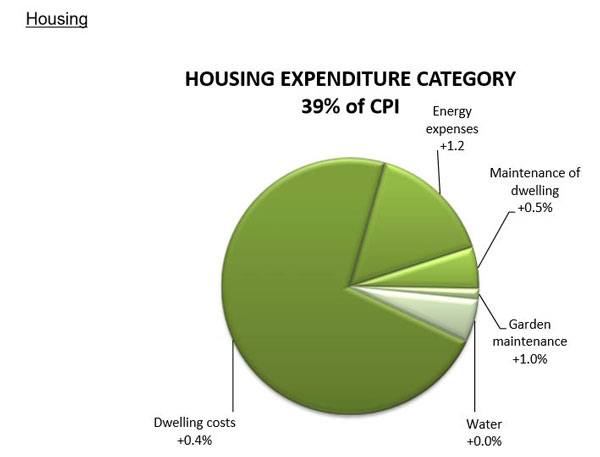
Within the Housing category, it was noted that four of the five product groups became more expensive and one remained stable. The product groups: ‘Energy Expenses’, ‘Maintenance of dwelling’, ‘Garden maintenance’ and ‘Dwelling costs’ increased by +1.2%, +0.5%, +1.0% and +0.4% respectively.
An increase in the consumer price of electricity by 1.3% largely influenced the total price change within the product group ‘Energy expenses’, while ‘Maintenance of dwelling’ was impacted most by pest control (-9.9%) and paint (+3.4%). The cost of soil and compost for gardening also increased (+14.3%), thus affecting the group ‘Garden maintenance’
1 Please note that the pie chart above depicts the share (weight) each food group carries toward the entire Housing expenditure category, whilst the percentages indicate the price change within that product group.
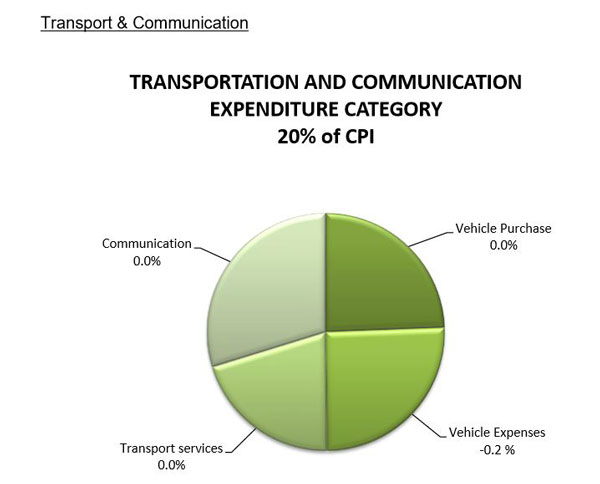
Of the four product groups within the Transport & Communication category, only vehicle expenses recorded a price change, namely a decrease of 0.2%. The drop in the cost of gasoline (-7%) and car tires (-1.6%) influenced this group.
Please note that the pie chart above depicts the share (weight) each food group carries toward the entire Transport & Communication expenditure category, whilst the percentages indicate the price change within that product group.
Sint Maarten Consumer Price Index a Broader Perspective
Though the trend over the past 3-year period depicts gradual increasing consumer prices, we note that prices have steadily declined during the period August 2015 through to April 2016; this is evident in the bar chart below. However, thereafter up to the current period (April 2017), there is a steady increase in the index, despite the slight drop in February 2017. Thus, over the last 3 years, consumer prices have shown some volatility, but seem to be gradually increasing.
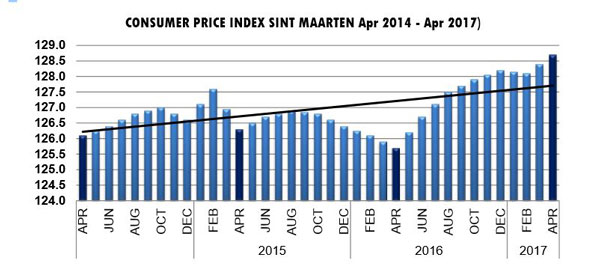
3-year Overview
The trend line below indicates that inflation on Sint Maarten over the prior 3-year period has been declining. It can be noted however, that the rate of inflation since December 2016 has gradually began to increase, recording 1.0% in April of this year.
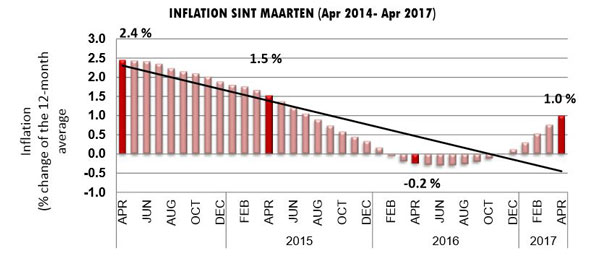
Inflation Sint Maarten April 2017
The 12-month average of consumer prices in April 2017 is 1.0%. This represents an increase of 3 percentage points when compared to average prices in the same period last year.
Inflation for the Major Expenditure Categories
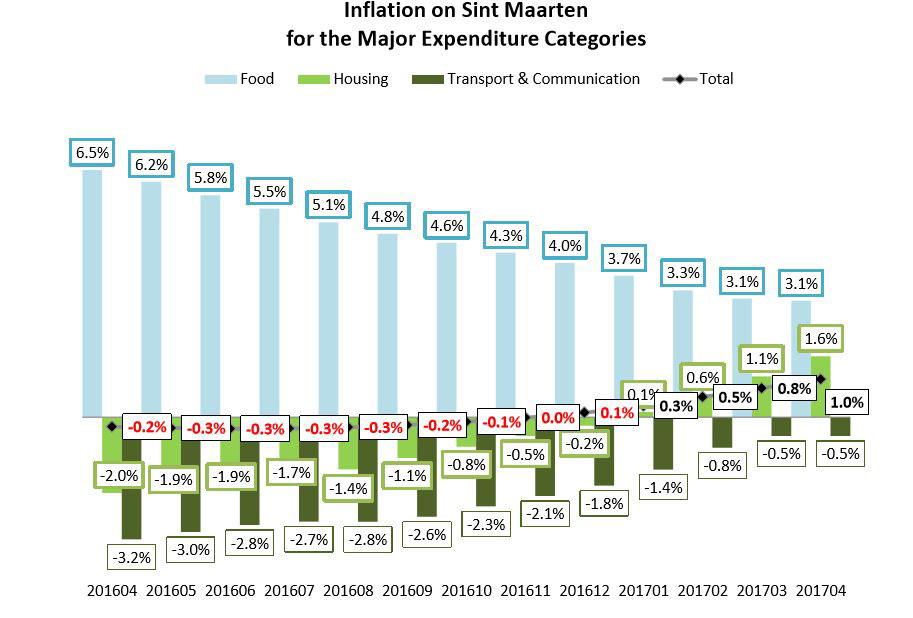
There are nine Household Expenditure Categories used to calculate the CPI. Three of these account for 69% of the total household expenditure: Housing (39%), Transportation & Communication (20%) and Food (10%).
Analysis of the monthly figures of these categories showed that inflation has steadily decreased in the Food category and deflation has been maintained in the Transport & Communication category. It should be highlighted that the average price development in the Housing category during the last four months have recorded inflation.
The monthly developments amongst the three major expenditure categories are illustrated in the bar chart above.
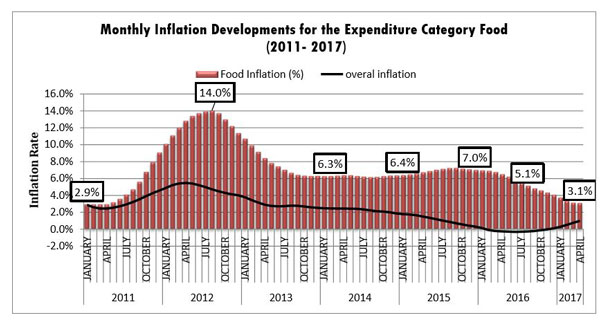
Food accounts for 10% of the total household expenditure. Over the past six years the inflation rate of food has generally mirrored that of the overall inflation rate for the observed nine expenditure categories. However, from September 2016 to present, while the inflation rate of food has continued to drop, the overall inflation rate has begun to show a steady increase. Moreover, it is notable that the current (April 2017) level of inflation recorded (3.1%) is comparable to early 2011. This observation is depicted in the graph above.