


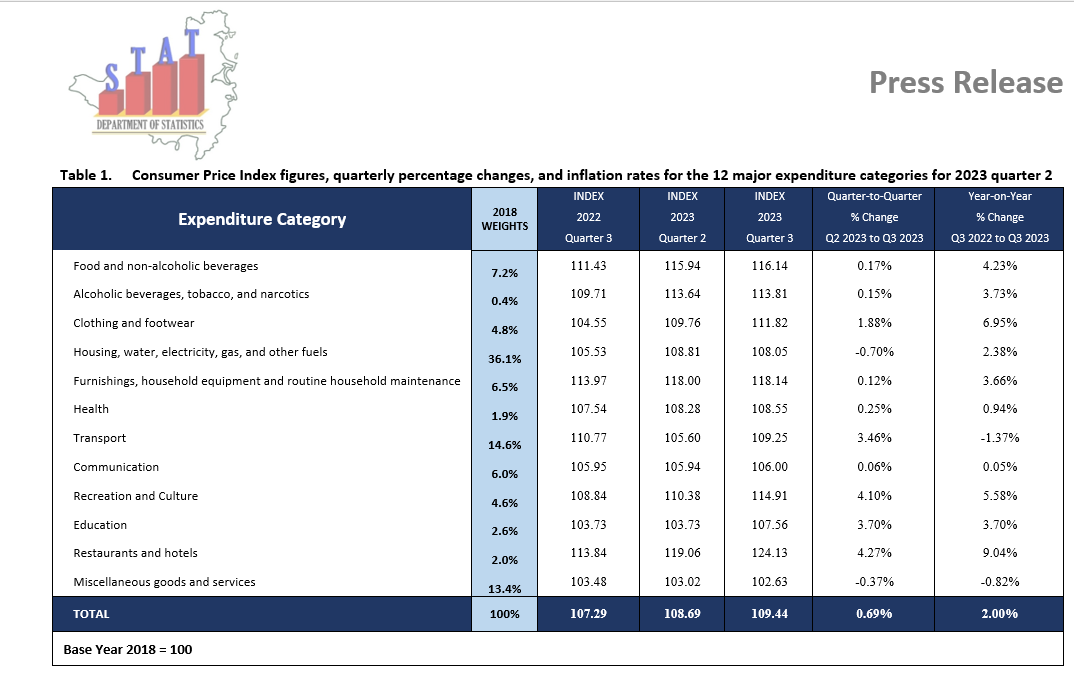
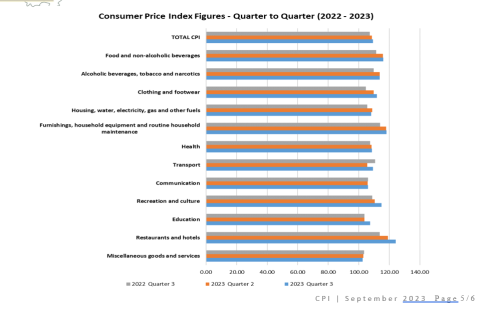
PHILIPSBURG:--- The Consumer Price Index (CPI) increased in the third quarter of 2023 to 109.44, which represented an increase of 0.69% when compared to the previous quarter. Additionally, when comparing consumer prices in the past year quarter three of 2022 to quarter three of 2023 the results show a notable increase of 2.00%.
 A Comparison of 2023 Q3 with 2023 Q2 revealed the highest Increases were in restaurants and hotels.
In the third quarter of 2023, prices rose in 10 of the 12 expenditure categories when compared to the second quarter of 2023. Increases were seen in the categories of “Restaurants and hotels” (+4.27%), “Recreation and culture” (+4.10%), “Education” (+3.70%), “Transport” (+3.46%), “Clothing and Footwear” (+1.88%), “Health” (+0.25%), “Food and non-alcoholic beverages” (+0.17%), “Alcoholic beverages, tobacco, and narcotics” (+0.15%), “Furnishings, household equipment and routine household maintenance” (+0.12%), “Communication” (+0.06%). Decreases are seen in the categories of “Housing, water, electricity, gas and other fuels” (-0.70%), and “Miscellaneous goods and services” (-0.37%).
Based on the latest Household Budget Survey, the following four categories[1] had the largest percentage weight (influence) when calculating the total CPI: “Housing, water, electricity, gas, and other fuels” (36.1%), “Transport” (14.6%), “Miscellaneous goods and services” (13.4%), “Food and non-alcoholic beverages” (7.2%).
- The change in the price of Housing, water, electricity, gas, and other fuels was influenced by a decrease in the price of the following subgroups: There was a decrease of 3.37% in persons renting houses, which was driven by the component “Actual rentals paid by tenants.” The price of “Maintenance and repairs on dwellings” also decreased by 1.69%, with a 2.18% decrease in the subcategory of “Materials for the maintenance and repair of the dwelling”. “Electricity, gas, and other fuels” increased by 4.11%, with a further increase in components “Electricity” (+4.74%) and “Solid fuels” (+1.54%).
- The prices of the category Transport were impacted by the subgroups “Purchase of vehicles” (+0.08%), “Motorcycles” (+6.93%), and “Bicycles” (+0.89%). “Operation of personal transport equipment[2]” (+8.94%) – the increase was derived from changes in “Fuels and lubricants for personal transport equipment” (+15.13%), however, there was a slight decrease in “Spare parts and accessories for personal transport equipment” (-0.41%). There was an increase in “Transport services” (+0.56%) which was led by “Passenger transport by air” which shows an increase of +1.59%.
- The prices in the category Miscellaneous goods and services were impacted due to the weighted decreases in “Personal care”[3] (-0.91%) which was driven by a decrease in “Other appliances, articles, and products for personal care” (-1.27%), and an increase in “Electric appliances for personal care” (+6.87%). “Personal effects n.e.c.[4]” the increase was driven by Jewelry, clocks, and watches” (+1.36%) and “Other personal effects” (+1.47%). “Social protection” decreased by 4.72%.
- For Food and non-alcoholic beverages, the subcategory “Food” increased by 0.08% and there was an increase in “Non-alcoholic beverages” by 0.70%. The price indices of the subcategory “Food” were influenced by the higher prices of “Oils and Fats” (+2.83%), “Food products n.e.c.[5]” (+1.96%), “Sugar, jam, honey, chocolate, and confectionery” (+1.57%), “Bread and cereals” (+1.33%), “Meat” (+0.89%), and “Vegetables” (+0.06%). Decreases were observed in “Milk, cheese, and eggs” (-3.26%), “Fruit” (-1.60%), and “Fish and Seafood” (-1.27%). The subcategory “Non-alcoholic Beverages” increased by “Coffee, tea, cocoa” (+3.45%); and “Mineral waters, soft drinks, fruit, and vegetable juices” (+0.28%).
Decreasing costs in two of the four major categories was not strong enough to keep the overall CPI from slightly increasing from the second to the third quarter of 2023.
 Third quarter Inflation comparison - 2022 Q3 with 2023 Q3 saw the highest increase in Restaurants and hotels.
The prices of the third quarter of 2023 increased when compared to those in the third quarter of 2022, with the inflation rate recorded at +2.00%. This rise in prices compared to the previous 12 months was due to an increase in household expenditure categories “Restaurants and hotels” (+9.04%), “Clothing and footwear” (+6.95%), “Recreation and culture” (+5.58%), “Food and non-alcoholic beverages” (+4.23%), “Alcoholic beverages, tobacco and narcotics” (+3.73%), “Education” (+3.70%), “Furnishings, household equipment and routine household maintenance” (+3.66%), “Housing, water, electricity, gas and other fuels” (+2.38%), “Health” (+0.94%), and “Communication” (+0.05%). The only decreases were in “Transport” (-1.37%) and “Miscellaneous goods and services” (-0.82%).
The prices of three of the four expenditure categories had the largest influence on the total CPI increase when compared to the same period in 2022.
- Housing, water, electricity, gas, and other fuels rose by 2.38%, driven by an increase in “Actual rentals for housing” (+10.84%), and “Water supply and miscellaneous services relating to the dwelling” (+0.25%). While there were decreases in “Electricity, gas, other fuels” (-6.20%), “Maintenance and repair of the dwelling” (-1.34%).
- As mentioned previously, Transport decreased by 1.37%; this was due to the decrease in “Operation of personal transport equipment including fuel” (-3.46%) and “Transport services” (-2.62%), however, there was a rise in “Purchase of vehicles” (+2.95%).
- Miscellaneous goods and services decreased by 0.82%, driven by decreases in “Financial services n.e.c.” (-9.56%) and “Social protection” (-4.72%). However, there were increases in “Insurance” (+4.50%), “Personal effects n.e.c.” (+1.29%), and “Personal care” (+0.51%).
- In addition, prices of Food and non-alcoholic beverages increased by 4.23%, influenced by “Non-alcoholic beverages” (+6.38%) and “Food” (+3.87%).
[1] The four categories are 1) Housing, water, electricity, gas, and other fuels, 2) Transport, 3) Miscellaneous goods and services, and 4) Food and non-alcoholic beverages.
[2] Purchases of spare parts, accessories, or lubricants made by households to undertake the maintenance, repair, or intervention themselves. If households pay an enterprise to carry out the maintenance, repair, or fitting, the total value of the service, including the costs of the materials used.
[3] Personal care – is considered as hairdressing salons and personal grooming establishments (S); electric appliances for personal care (SD); and other appliances, articles, and products for personal care (ND).
[4] Personal effects n.e.c. – are considered as jewelry, clocks, watches, travel goods and other carriers, and articles for babies.
[5] Food products n.e.c. (not elsewhere classified) - are considered as sugar cane consumed for extracting juice or as a snack; prepared baking powders and yeasts, broth, stocks, bouillon cubes, soup bases, agar-agar, instant dessert preparations; and nutritional supplements and fortified food products.