


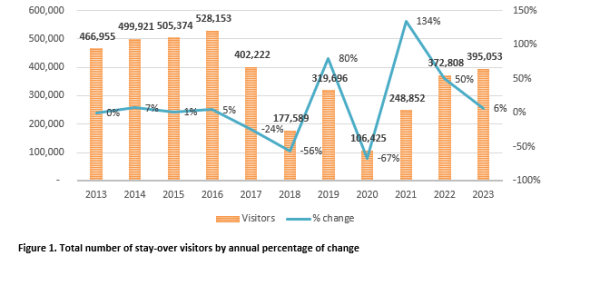
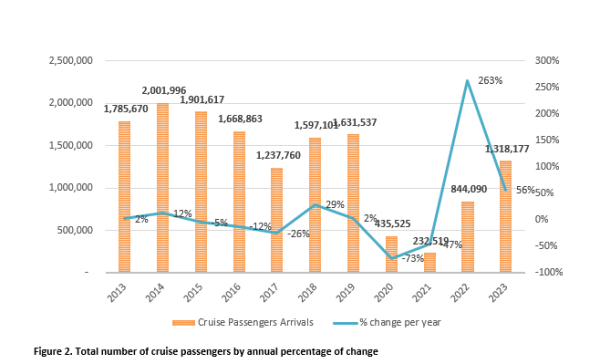
 PHILIPSBURG:--- Stay-over tourism refers to the act of traveling to a different location and spending at least one night there. Since the pandemic, there has been a boost in travel because of the pent-up demand to travel post-COVID restrictions. The tourism industry of St. Maarten saw an annual increase in stay-over tourism of 6% in 2023 when compared to 2022 and 59% compared to 2021. Whereas cruise tourism arrivals witnessed an increase of 56% in 2023 in comparison to 2022, and an increase of 467% when compared to 2021.
Tourism Exit Survey 2023 Results
The Tourism Exit Survey (TES) covered a sample of all tourists visiting St. Maarten using Airlines and Cruise vessels. In this case, the focus was placed particularly on tourists who left the island by aircraft via the Princess Juliana International Airport and Cruise ship at the Port of St. Maarten Harbour. The survey’s objective was to measure and obtain the purpose of the visit and the economic activities of tourists on the island. The following provides a summary of the 2023 results.
 Stay-Over Tourism Visitors results
- The average age of visitors was 45, with both males averaging 47 years and females averaging 44 years. However, the highest percentage of respondents were in the age range of 55 – 64 years. The average party size was two persons of which 9% traveled alone, 42% traveled with their spouse or partner only, and 45% traveled in other categorized groups of two or more persons.
- Approximately 58% of the respondents were visiting the island for the first time. Of the 42% returning visitors, 8% indicated that their first visit to the island was by cruise. Most repeat visitors frequented the island five or more times (46%). Overall, 82% of respondents indicated a high likelihood to recommend the island as a visit destination, and 84% had intentions to revisit it in the future. This correlates with results indicating that 92% of respondents' visit expectations were either met or exceeded.
- The primary purpose for visiting the island was for leisure (80%). This was followed by persons visiting friends/relatives (4%), those who came for honeymoons/weddings (3%), business/conventions (3%), and yachting and other reasons (1%) respectively.
- With most respondents having an annual household income of $125,000 (37%), the average stay was 7 days and the amount spent on average was $149 per day. Europeans’ length of stay, 13 days, was the highest and almost twice that of the average stay of all visitors. Also, the highest average aggregated expenditure per region came from USA visitors ($161.67), when excluding persons who did not report their region of residence. This was followed by Caribbean visitors ($137.15), Canadians ($129.31), Other regions composed or African and Asian countries ($123.61), Europeans ($94.04), and Latin America ($52.77).
- While on the island the top accommodation venues were hotels (51%), timeshares (18%), the alternative lodgings industry, Airbnb, VRBO, HomeAway, etc. (11%), and Condos/Villas (9%). On average, 61% of the respondents’ money was spent on accommodations, 16% on food (groceries or dining), and 5% on rental cars. The top 5 most conducted activities during their stay involved visiting the beaches, shopping, dining, visiting the capitals for various reasons, and plane watching.
 Cruise arrivals visitors' results
- The average age of visitors was 51, with both males averaging 52 years and females averaging 50 years. However, the highest percentage of respondents were in the age range +65 years (31%). The average party size was two persons of which 4% traveled alone, 44% traveled with their spouse or partner only, and 48% traveled in other categorized groups of two or more persons and 4% did not respond to the question.
- First-time Cruise visitors accounted for 54% of St. Maarten’s cruise visitors. Of the persons visiting again, 17% visited once before, 26% visited twice, 21% visited 3 times, 13% visited 4 times, and 23% visited 5 times before. Overall, 3% of respondents indicated a high likelihood to recommend the island as a visit destination, and 82% had intentions to revisit it in the future. This correlates with results indicating that 89% of respondents' visit expectations were either met or exceeded.
- Most respondents had an annual household income of $125,000 and over (19%) and the amount spent on average was $142.56 per day. Also, the highest average aggregated expenditure per region came from USA visitors ($176.39), when excluding persons who did not report their region of residence. This was followed by Caribbean visitors ($175.50), Europeans ($65.76), Canadians ($47.81), and Other regions composed or African and Asian countries ($23.13).
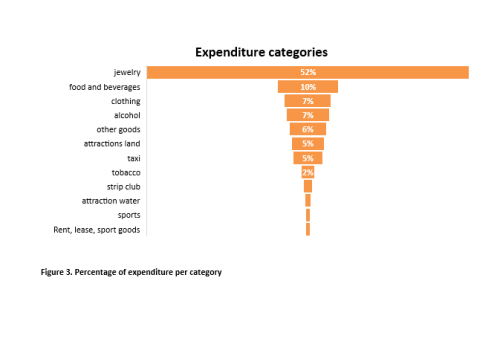
- On average, 52% of the respondents’ money was spent on jewelry, 10% on food and beverages, and 7% on tobacco, 6% on other goods, 5% on land attractions and taxis respectively. The top 5 most conducted activities during their stay involved shopping, visiting the beaches, visiting Philipsburg for various reasons, dining, and plane watching.